
Anomaly AI
Analyze large datasets and spreadsheets with AI. Ask questions to generate interactive dashboards, Excel reports, slides, and scheduled alerts automatically.
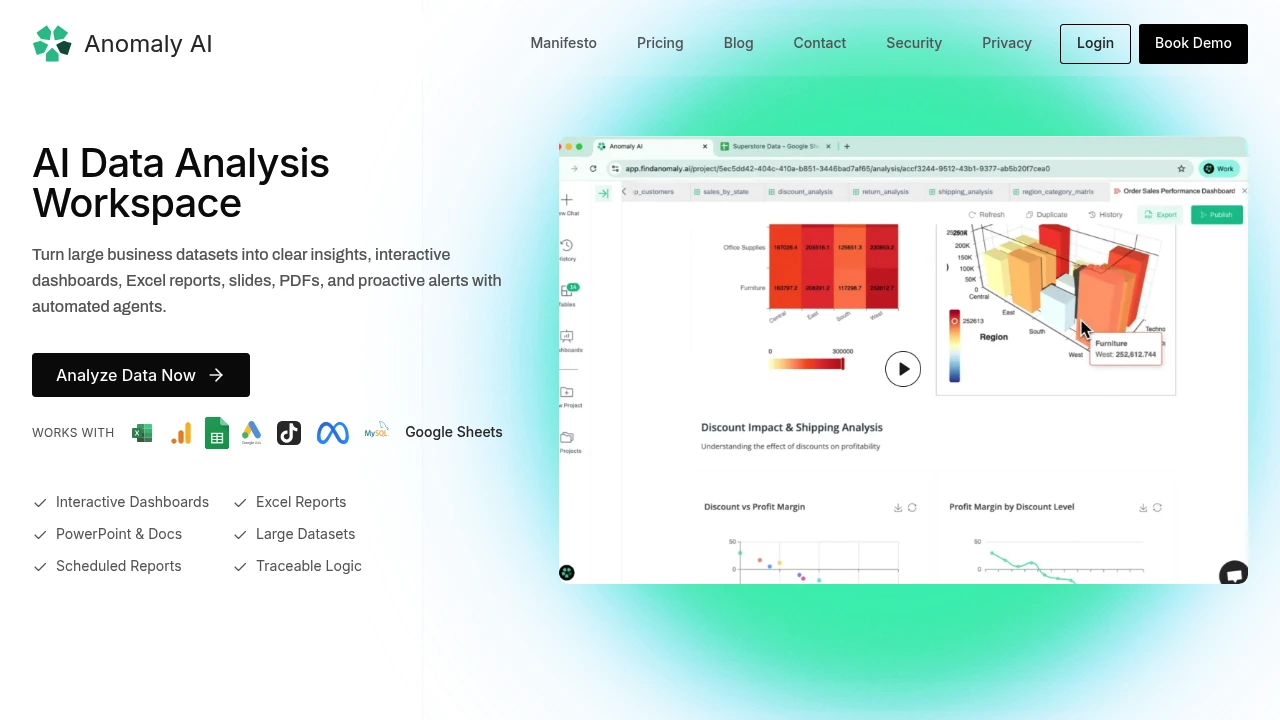
Transform complex business data into actionable insights, dashboards, reports, and presentations from a single analytics workspace. Designed for teams that rely on spreadsheet-based workflows but need greater scalability and reliability, the platform helps organizations consolidate data, improve quality, define business metrics, and generate decision-ready outputs.
Turn Business Data Into Trusted Insights
Bring data from multiple sources into one centralized environment where it can be cleaned, standardized, analyzed, and transformed into meaningful business intelligence.
From marketing performance and financial reporting to operational analytics and executive dashboards, the platform helps teams move from raw data to informed decisions faster.
Key Features
Unified Data Integration
Connect data from a wide range of business systems and analytics platforms.
Supported sources include:
- Excel spreadsheets
- Google Analytics 4 (GA4)
- Google Ads
- Meta Ads
- BigQuery
- MySQL databases
and other business data sources.
Automated Data Quality Checks
Improve confidence in your analysis by identifying issues before reporting begins.
Automatically detect:
- Missing values
- Data inconsistencies
- Duplicate records
- Outliers
- Quality anomalies
to ensure a reliable foundation for decision-making.
Custom KPIs & Business Metrics
Define business logic once and apply it consistently across reports and dashboards.
Create:
- Revenue metrics
- Marketing KPIs
- Operational benchmarks
- Financial calculations
- Custom performance indicators
that can be reused throughout the organization.
Interactive Dashboards
Visualize key business metrics through dynamic, shareable dashboards.
Monitor:
- Performance trends
- Business health
- Campaign effectiveness
- Financial outcomes
- Operational metrics
in real time.
Automated Reporting & Presentations
Generate professional reporting outputs without manual spreadsheet work.
Create:
- Excel reports
- PowerPoint presentations
- PDF summaries
- Executive reports
- Stakeholder updates
from a single source of truth.
Scheduled Alerts & Monitoring
Stay informed about important changes in business performance.
Configure alerts for:
- KPI thresholds
- Performance anomalies
- Business milestones
- Operational changes
- Reporting updates
to support proactive decision-making.
Traceable Analytics & Auditability
Maintain visibility into how every insight is calculated.
Track:
- Source datasets
- Business rules
- Calculations
- Transformations
- Reporting logic
to improve transparency and trust in analytics outputs.
Built for Reliable Business Intelligence
The platform is designed to help teams move beyond disconnected spreadsheets and manual reporting workflows.
Key benefits include:
- Centralized analytics
- Improved data quality
- Consistent business metrics
- Automated reporting
- Transparent calculations
Built For
- Business Analysts
- Marketing Teams
- Finance Teams
- Operations Teams
- Data Teams
- Business Leaders
Common Use Cases
- Executive reporting
- Marketing analytics
- Financial reporting
- KPI tracking
- Business intelligence
- Data consolidation
Why It Matters
Many organizations struggle with fragmented data, inconsistent reporting logic, and time-consuming spreadsheet workflows. As datasets grow larger and more complex, maintaining trust in reports becomes increasingly difficult. By combining data integration, quality validation, KPI management, reporting automation, and traceable analytics into a single platform, teams can generate more reliable insights while significantly reducing manual effort.
Build a Trusted Analytics Workflow
Connect business data, automate quality checks, define reusable KPIs, and generate dashboards, reports, presentations, and alerts from a centralized analytics platform designed for modern data-driven teams.


