
Diagrflow
Create PRISMA 2020 systematic-review flow diagrams from your counts and export clean SVG or PNG files.
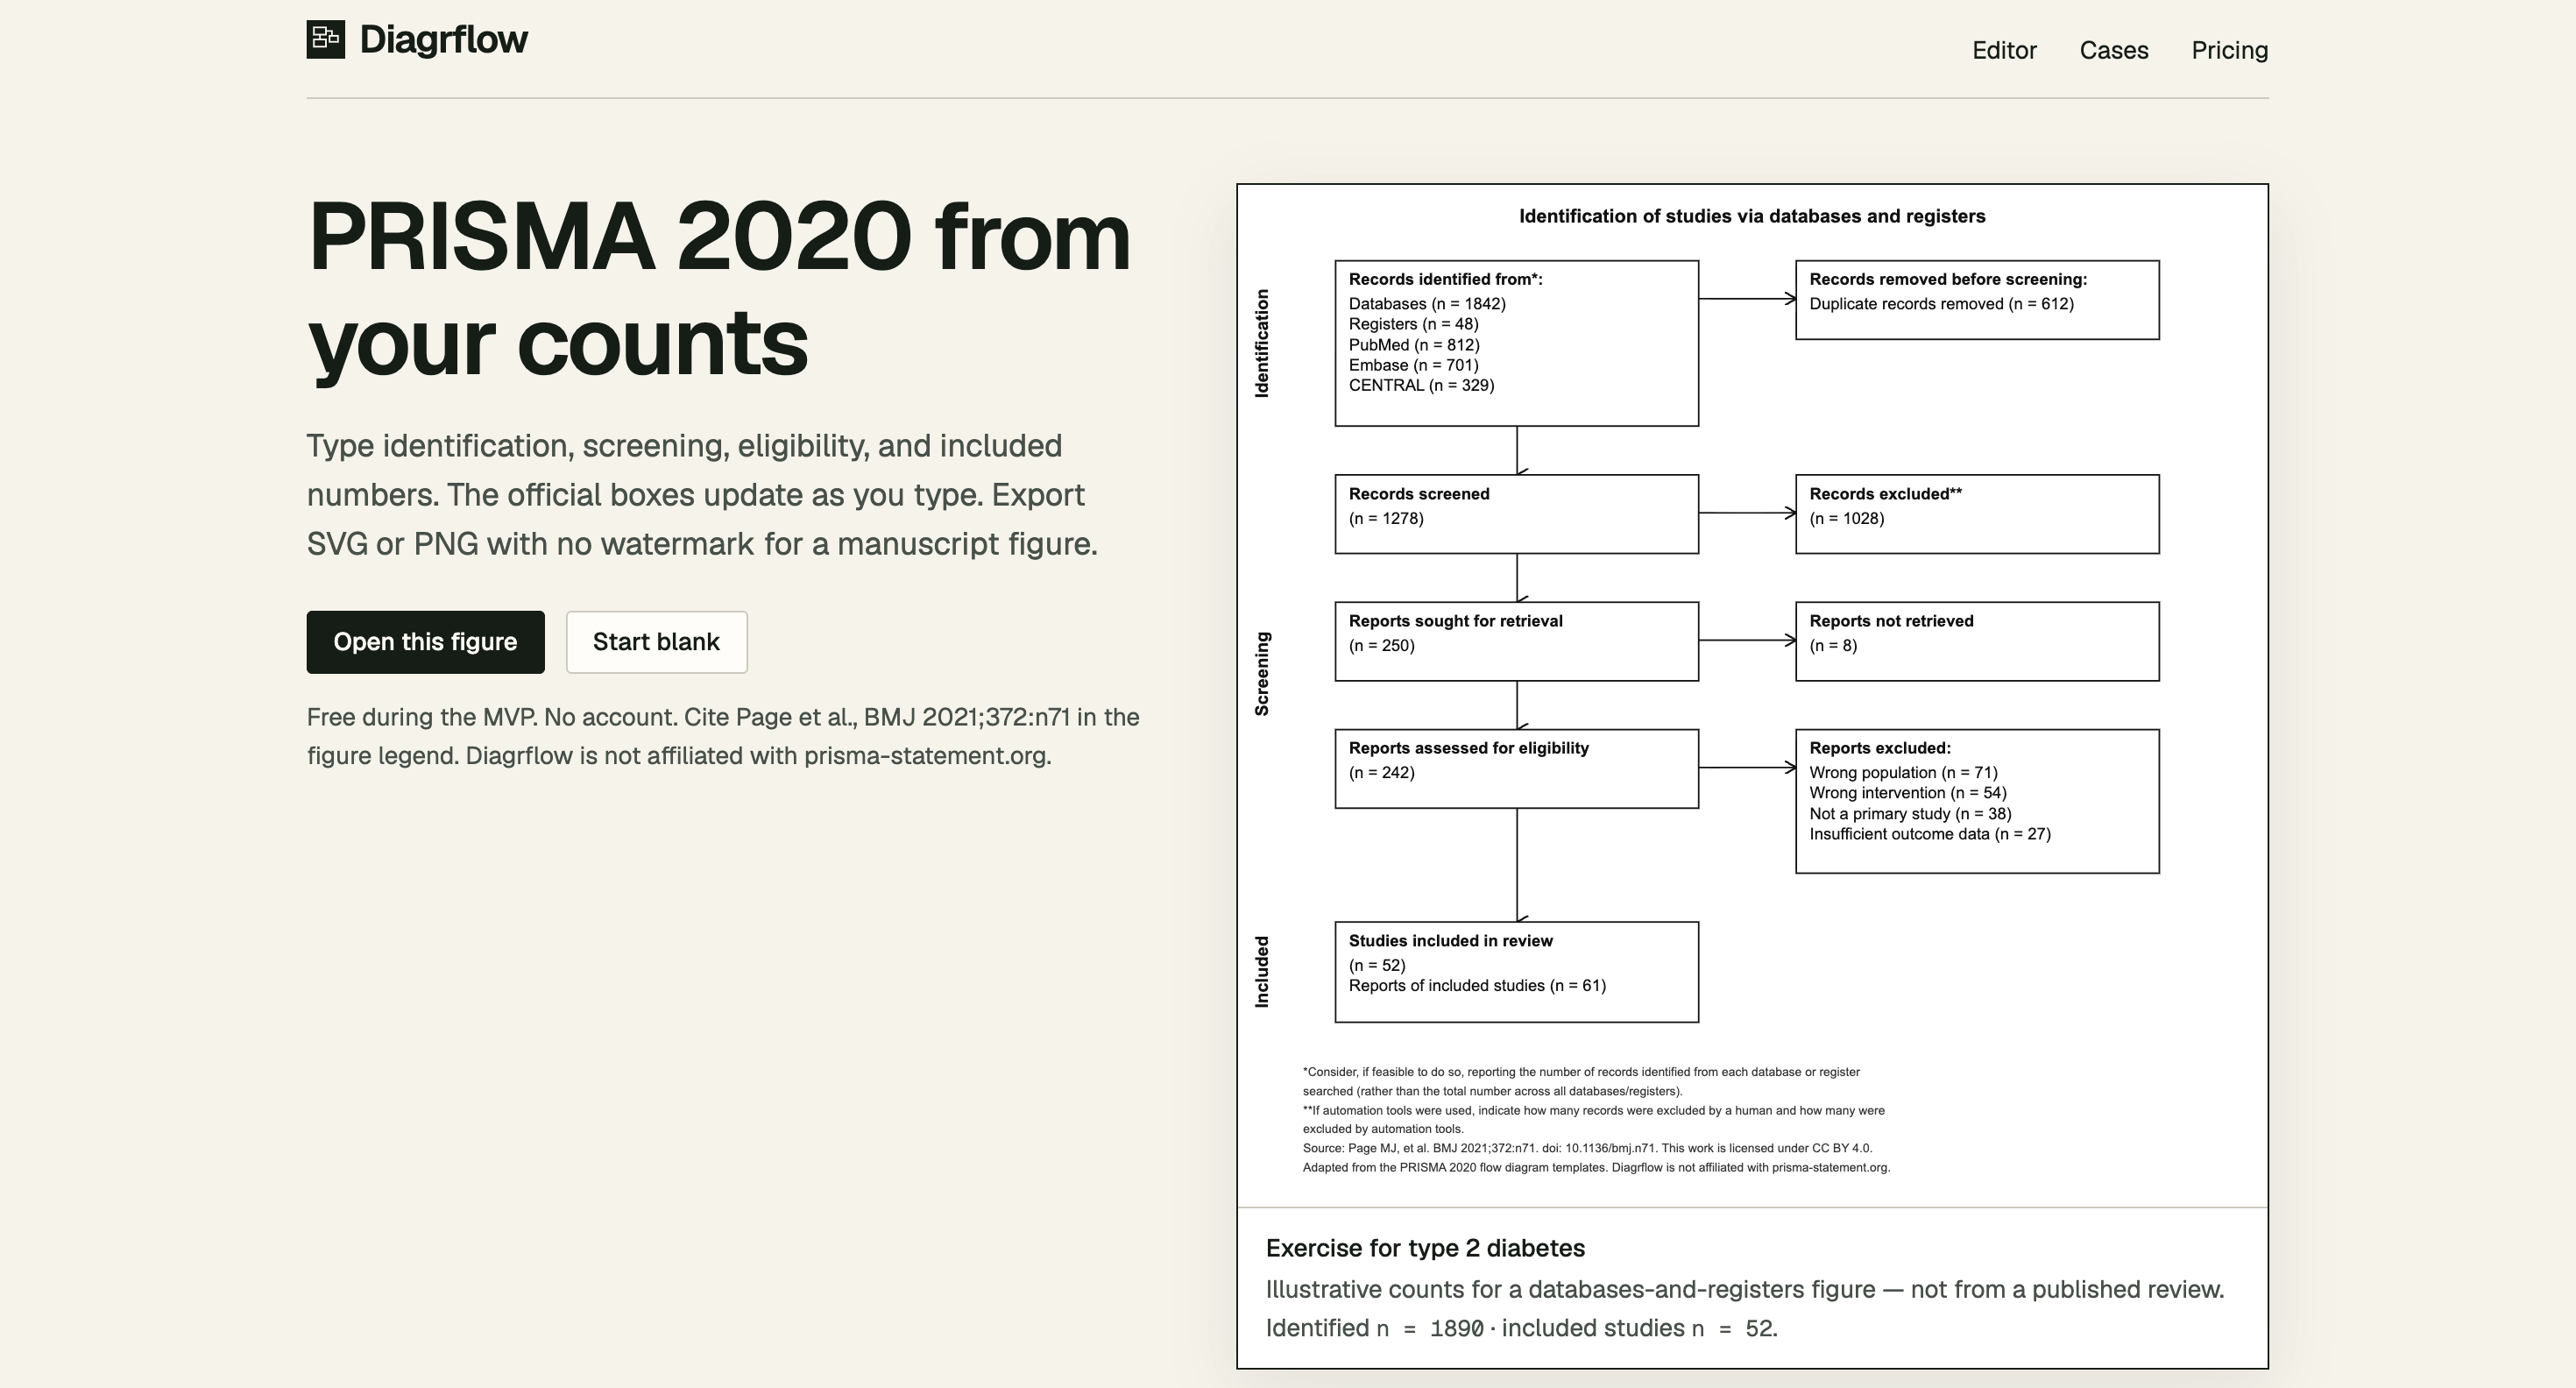
Diagrflow is a PRISMA 2020 flow diagram generator for systematic-review authors who need to turn screening and study-selection counts into a publication-ready figure. It is designed for researchers preparing manuscripts who want the standard PRISMA boxes, wording, and structure without having to build the diagram manually.
The tool works by entering counts for identification, screening, eligibility, and included studies. The diagram updates as the numbers change and uses the PRISMA 2020 terminology for new reviews, including the distinction between records, reports, and studies.
Key Features
Live Diagram Preview
Build the flow diagram while entering your review counts.
The official boxes and connecting arrows update automatically as the numbers change, allowing you to see the final structure before exporting it.
Balance Checks
Check whether the entered counts reconcile correctly.
Diagrflow flags totals that do not balance, helping authors catch inconsistencies in their screening numbers before placing the figure into a manuscript.
Diagram Variants
Support different systematic-review screening workflows.
The tool handles common PRISMA 2020 topologies, including:
- Databases-only searches
- Citation searching
- Automation-tool removals
- Other-methods searches
- Different identification and screening pathways
An optional other-methods column is available when the review requires it.
PRISMA 2020 Wording
Use terminology aligned with the PRISMA 2020 format for new reviews.
The diagrams distinguish between records, reports, and studies, helping the resulting figure follow the structure expected for current systematic-review reporting.
SVG and PNG Export
Export the completed diagram for use in a manuscript.
Diagrflow supports clean SVG and PNG exports, with no watermark, so the generated figure can be placed directly into a paper or submission workflow.
No Account Required
Use the MVP without creating an account.
Authors can enter their counts, build the diagram, and export the result without going through a sign-up process.
Built for Systematic-Review Authors
Diagrflow is focused specifically on researchers who need to convert screening data into a PRISMA 2020 flow diagram.
Key benefits include:
- Enter identification counts
- Enter screening counts
- Enter eligibility counts
- Enter included-study counts
- Generate the diagram automatically
- Check whether totals reconcile
- Use PRISMA 2020 terminology
- Handle common review topologies
- Include citation-searching workflows
- Include automation-tool removals
- Add other-methods pathways
- Export SVG files
- Export PNG files
- Export without a watermark
- Use without creating an account
Built For
- Systematic-Review Authors
- Researchers
- Academic Authors
- Evidence-Synthesis Teams
- Graduate Students
- Research Groups
- Manuscript Preparation Teams
Common Use Cases
- Creating PRISMA 2020 flow diagrams
- Preparing systematic-review manuscripts
- Converting screening counts into figures
- Checking screening-number consistency
- Documenting study selection
- Reporting database searches
- Reporting citation searches
- Showing automation-tool removals
- Preparing manuscript-ready figures
- Exporting PRISMA diagrams as SVG
- Exporting PRISMA diagrams as PNG
Why It Matters
Creating a systematic-review flow diagram can become a tedious formatting task when authors have to manually arrange boxes, arrows, terminology, and screening counts.
Diagrflow focuses on turning the numbers already recorded in a search and screening workflow into a structured PRISMA 2020 figure. As counts are entered, the diagram redraws automatically and balance checks help identify totals that do not reconcile.
The use of PRISMA 2020 wording is particularly important for new reviews. The tool follows the record, report, and study distinction and supports common review structures such as database searches, citation searching, and automation-tool removals.
The exported SVG and PNG files are designed for manuscript use and do not include a watermark. This makes the tool useful when the goal is not simply to visualize screening numbers, but to produce a figure that can move directly into an academic paper.
Diagrflow also provides sample figures showing the main layouts, allowing authors to understand how different review pathways will appear before entering their own data.
Create a PRISMA 2020 Flow Diagram With Diagrflow
Enter your identification, screening, eligibility, and included-study counts, check that the numbers reconcile, and export a clean PRISMA 2020 flow diagram as SVG or PNG for your systematic-review manuscript.


