
PatternsRadar
Build stock scans with blocks or text, screen 3,700+ NSE instruments, and replay matches across up to 30 years of daily history.
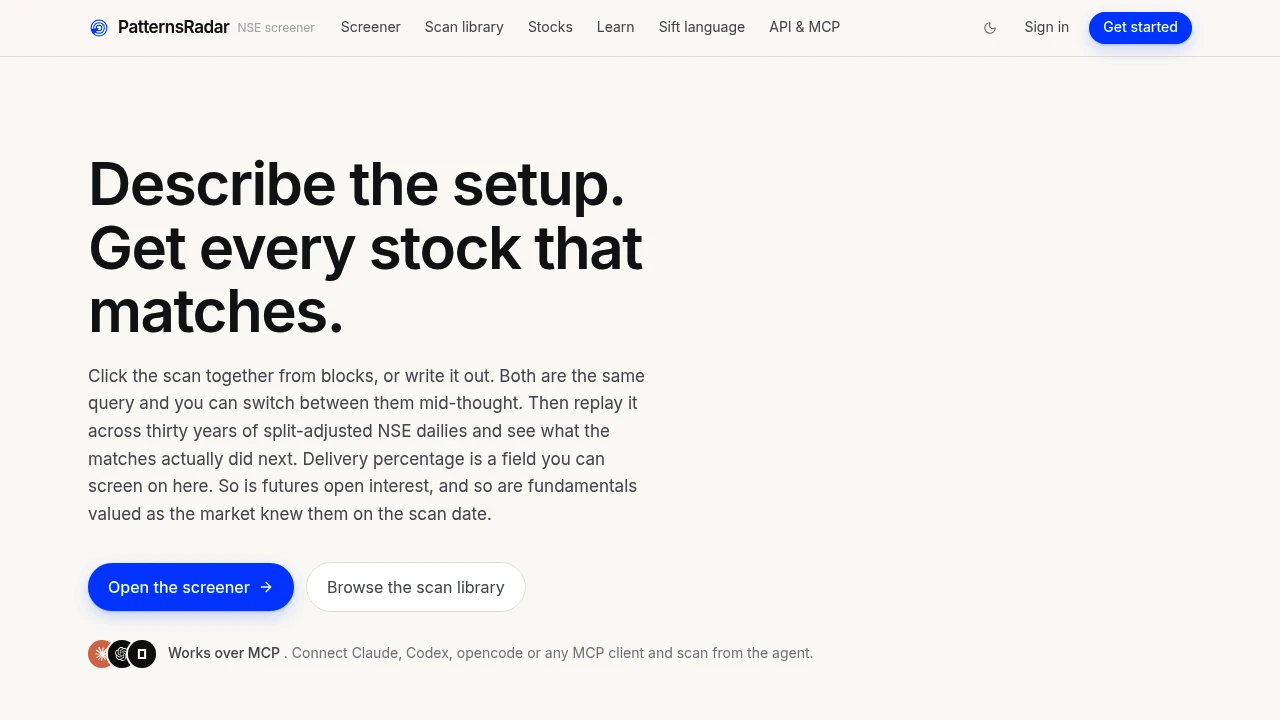
This NSE stock screener is built for traders, quant-curious investors, and researchers who want to test market ideas against real historical data rather than simply filter today's quotes. You can build scans visually by connecting blocks or write the same query directly in text, then switch between the two views without rebuilding the strategy.
The platform covers more than 3,700 instruments using split-adjusted daily market data going back to 1995. Its key distinction is that screening and historical backtesting use the same query, allowing a scan created for today's market to be replayed across historical sessions and evaluated against actual past conditions.
Key Features
Visual and Text Query Builder
Build a stock screen using visual blocks or write the query directly in text.
Both interfaces are connected to the same parsed query, so you can:
- Build a scan visually
- Write the equivalent query in text
- Switch between visual and text views
- Reuse the same query without rebuilding it
- See syntax problems as you type
The query language supports nested groups, NOT logic, crossings with lookback, sorting, and result limits.
Point-in-Time Fundamentals
Use fundamental data according to what was known by the market at the relevant historical date.
This is important for backtesting because the screener does not simply apply today's fundamental values to historical sessions. Point-in-time data allows historical scans to use fundamentals as they were available at that time.
Historical Scan Replay
Replay a screen across up to 30 years of trading sessions using split-adjusted NSE daily data.
A historical replay can show:
- What matched the scan
- Win rate
- Median move
- Payoff
- Excess return versus an index
This makes the platform useful for testing whether a screening idea has held up across different periods rather than evaluating it only against today's market.
Price and Volume Screening
Build scans using core market data such as price and volume.
These fields can be combined with other market and fundamental conditions to create more specific screening rules.
Futures Open Interest
For stocks with derivatives, screening can incorporate futures-related data.
Supported F&O fields include:
- Futures open interest
- Open interest change
- Basis
- Put-call ratios
This allows traders to include derivatives activity alongside price and volume conditions when constructing a scan.
Delivery Percentage
Delivery percentage is available as a first-class filter and sorting field.
This allows traders to incorporate delivery behavior directly into their screening logic rather than treating it as separate information that has to be checked manually.
Saved Scan Alerts
Paid plans can send end-of-day email alerts for watched scans.
This allows traders to save a screening setup and receive notifications when its conditions produce relevant results at the end of a trading session.
API and MCP Access
Run the same scans outside the browser through API and MCP access.
The same query can therefore be reused from:
- Browser workflows
- Scripts
- Coding environments
- AI coding agents
The browser, API, and MCP server use the same underlying code paths, helping keep results consistent regardless of where the scan is executed.
Inspect the Query and SQL
The platform provides visibility into how a screening request is interpreted.
You can inspect:
- The parsed query
- Syntax errors while writing
- The generated SQL
- The exact statement that ran
This is particularly useful for researchers and technically inclined traders who want to understand precisely what their screen is executing rather than treating the result as a black box.
Built For NSE Market Research
Traders
Create repeatable scans for price, volume, delivery, derivatives activity, and fundamentals instead of manually checking hundreds of stocks.
Quant-Curious Investors
Turn trading ideas into explicit screening rules and replay them across historical market data.
Researchers
Test whether patterns continue to produce useful results across different historical periods.
Technical Users
Use the query language, generated SQL, API, or MCP access to integrate market screening into research and coding workflows.
Common Use Cases
Test a Trading Idea
Translate a market hypothesis into a query and replay it against historical NSE sessions to see how it performed.
Build Multi-Condition Screens
Combine price, volume, delivery percentage, F&O fields, sector information, and point-in-time fundamentals within one query.
Research Historical Patterns
Run the same screen across historical sessions and review its win rate, median move, payoff, and excess return.
Monitor a Saved Strategy
Save a scan and receive end-of-day email alerts when its conditions produce matches.
Automate Market Research
Run existing scans through the API or MCP server from scripts and coding-agent workflows.
One Query for Screening and Backtesting
The platform's central design is that the screen and the backtest are part of the same query.
That creates a continuous workflow:
Build query → Screen market → Replay historically → Evaluate results → Monitor scan
You do not need to translate a screening idea into a separate backtesting language or recreate the logic in another tool. The same query can move from the browser to historical replay, API calls, or MCP-based workflows.
Long-Term NSE Data
The platform uses split-adjusted daily bars covering more than 3,700 instruments and extending back to 1995.
This long historical window allows researchers to examine screening ideas across different market environments instead of relying only on recent performance.
The data and analysis remain NSE-focused and end-of-day, making the platform specifically suited to daily screening and historical research rather than intraday trading.
Important Scope
The platform is designed for screening and research rather than complete portfolio or execution management.
It does not provide:
- Intraday bars
- Option chains
- Portfolio management
- Brokerage modeling
- Slippage modeling
- Position-sizing modeling
Historical replay therefore evaluates the screening logic and resulting market behavior without attempting to reproduce every practical detail of a live trading strategy.
Why It Matters
A stock screen can look convincing when tested against today's market, but that does not establish whether the underlying idea has worked historically. Separating screening from backtesting also introduces the risk that the same logic gets interpreted differently in each environment.
This platform keeps the query consistent across screening and historical replay. Point-in-time fundamentals help preserve the information available at each historical date, while long-range NSE daily data provides the basis for testing ideas across multiple market periods.
The result is a workflow for moving from market hypothesis to repeatable screen to historical evidence before deciding whether a pattern deserves further investigation.
Build, Test, and Monitor NSE Screens
Create stock screens visually or in text, combine market, delivery, F&O, sector, and point-in-time fundamental data, and replay the same query across up to 30 years of NSE history. With generated SQL, API and MCP access, historical performance metrics, and paid end-of-day scan alerts, the platform provides a structured environment for testing and monitoring NSE trading ideas.


