
Laritor
Get real-time performance monitoring, observability, and AI-powered insights for your Laravel applications. Receive instant alerts to find and fix issues fast.
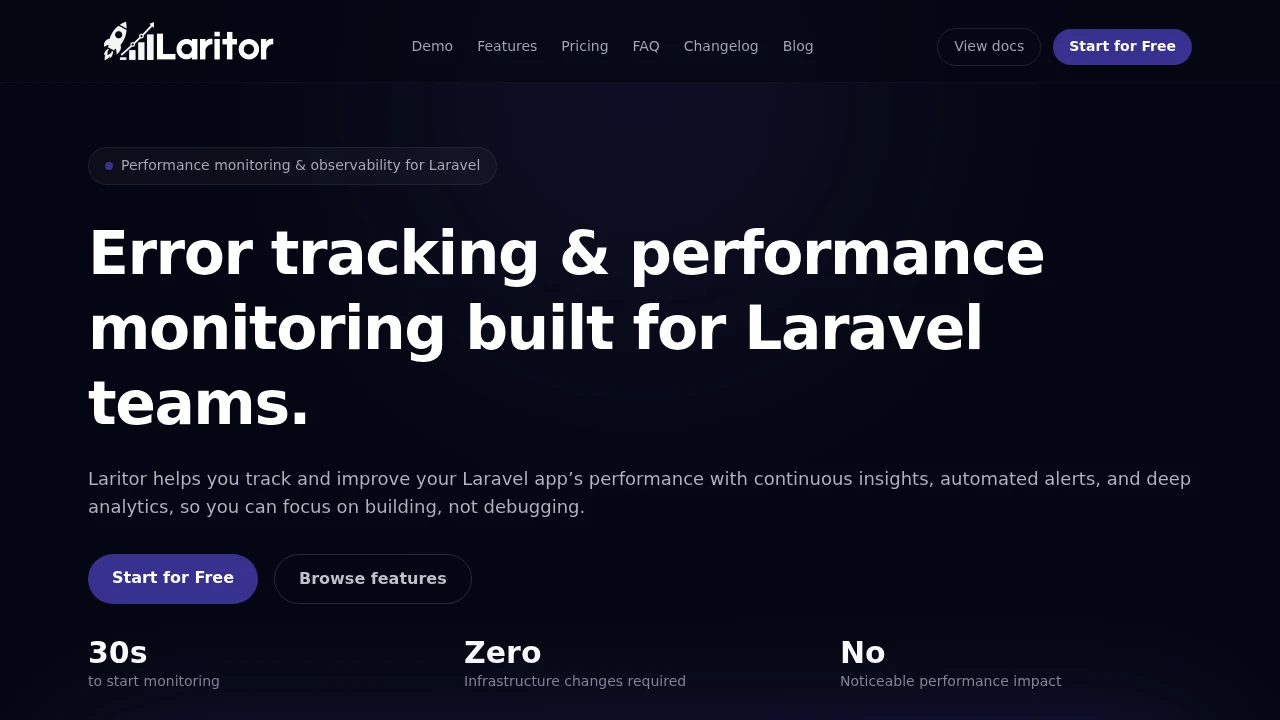
Monitor, debug, and optimize your Laravel applications with a comprehensive performance observability platform built specifically for Laravel developers. Gain real-time visibility into application behavior, identify bottlenecks faster, and receive actionable insights that help improve reliability, performance, and user experience.
Understand Every Request in Your Laravel Application
Track requests, background jobs, database queries, exceptions, and application metrics from a single dashboard.
With a lightweight setup process and minimal performance overhead, you can start collecting meaningful insights in seconds without making infrastructure changes or managing complex monitoring systems.
Key Features
Deep Error Tracking
Identify and resolve application issues with detailed exception monitoring and diagnostics.
Analyze:
- Exception traces
- Stack traces
- User context
- Request metadata
- Error frequency
to quickly understand the root cause of problems.
Interactive Request Timeline
Visualize the complete lifecycle of every application request, job, or command.
Track:
- Database queries
- Background jobs
- Email activity
- Application logs
- Request execution flow
to pinpoint slowdowns and performance issues.
Laravel Performance Monitoring
Measure application health and performance across critical components.
Monitor:
- Request duration
- Database performance
- Queue processing times
- Background job execution
- Application responsiveness
to maintain a fast and reliable user experience.
AI-Powered Optimization Recommendations
Receive intelligent suggestions for improving application performance.
Get insights into:
- Query optimization opportunities
- Database bottlenecks
- Performance inefficiencies
- Application architecture issues
- Execution path improvements
to accelerate troubleshooting and optimization efforts.
Real-Time Alerts & Notifications
Stay informed when critical issues affect your application.
Configure alerts for:
- Error spikes
- Slow requests
- Failed health checks
- Performance degradation
- Application incidents
and deliver notifications through your preferred communication channels.
Custom Dashboards
Create monitoring views tailored to your development and debugging workflows.
Build dashboards for:
- Performance metrics
- Error monitoring
- Infrastructure health
- Business-critical endpoints
- Team-specific insights
using flexible drag-and-drop components.
Built for Laravel Developers
The platform is designed specifically for Laravel applications, providing deeper framework-level visibility than generic monitoring tools.
Key benefits include:
- Fast installation
- Laravel-native insights
- Minimal performance impact
- Centralized observability
- Actionable diagnostics
Built For
- Laravel Developers
- Software Engineers
- DevOps Teams
- SaaS Companies
- Engineering Managers
- Development Agencies
Common Use Cases
- Application performance monitoring
- Error tracking
- Query optimization
- Production debugging
- Incident response
- Laravel observability
Why It Matters
As Laravel applications grow, identifying the root cause of performance issues and production errors becomes increasingly difficult. Developers often spend hours piecing together logs, metrics, and traces from multiple tools. By combining request timelines, error tracking, performance monitoring, AI-powered recommendations, and alerting into a single platform, teams can diagnose issues faster and spend more time building features instead of troubleshooting infrastructure.
Optimize Laravel Applications with Confidence
Gain complete visibility into your Laravel application's performance, errors, and execution flow through a unified observability platform designed to help teams ship faster, debug smarter, and maintain reliable applications at scale.


