
OIData
Live open interest analytics for NIFTY, SENSEX, stock options and futures through your own broker connection.
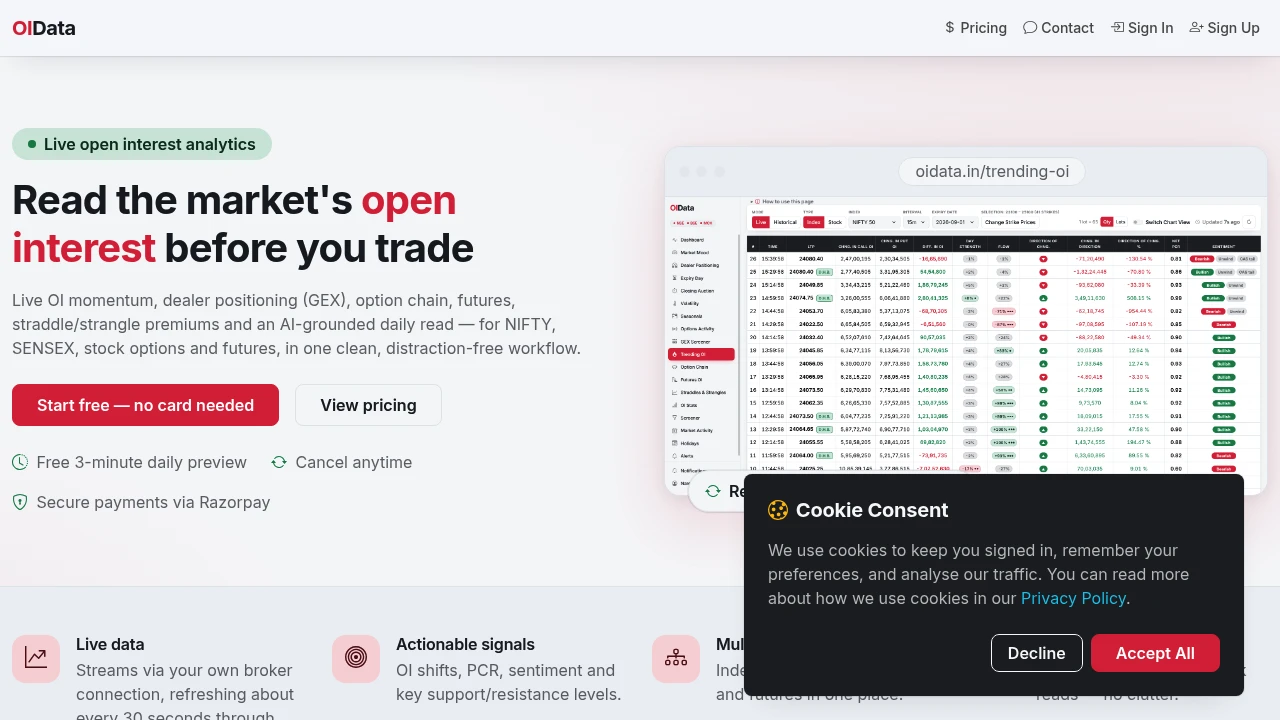
This open-interest analytics platform helps Indian derivatives traders get a faster read on NIFTY, SENSEX, stock options, and futures using live market data from their own broker connection. Built for traders and analysts focused on positioning, volatility, and expiry setups, it brings open interest, option chain, dealer positioning, sentiment, and market activity into a focused interface without placing trades.
Connect your SEBI-registered broker account and scan market conditions during trading hours with regular data refreshes. Instead of switching between separate screens, the platform combines multiple derivatives analytics views, alerts, futures OI, volatility data, expiry-day tools, options activity, and auction trackers in one workspace.
Key Features
Trending Open Interest
Track changing call and put positioning as market conditions develop. The Trending OI view helps traders quickly identify shifts in open interest and important price breaks.
- Call and put open interest shifts
- Net PCR
- Sentiment indicators
- Day high and low breaks
- Live market-hour refreshes
Option Chain Analysis
Review the option chain with the metrics needed to understand positioning around individual strikes and broader expiry setups.
- Open interest
- OI change
- Implied volatility
- Volume
- Max pain
- Support and resistance
- Built-in strike interpretation
Dealer Positioning and GEX
Analyze dealer positioning through gamma exposure and key option structures. The dealer positioning view brings several measures together to help assess how positioning may be distributed across indices and F&O stocks.
- Net GEX
- Call walls
- Put walls
- Gamma flip
- Pin conviction
- Hedge ladder
Straddles and Strangles
Follow ATM and custom straddle and strangle premiums alongside spot movement and combined open interest.
This provides a focused way to assess premium behavior and positioning around the underlying rather than relying only on price charts.
AI-Assisted Market Briefs
Get a consolidated market read through the dashboard and briefs. The platform provides an AI-assisted interpretation of market conditions alongside overnight sentiment and headline-level bullish versus bearish splits.
- Market read
- Overnight sentiment
- Bullish headline split
- Bearish headline split
- Dashboard-based market overview
Market Mood Index
Use a 0 to 100 sentiment indicator built from market internals. The Market Mood Index provides both a current reading and historical context, with zone markers to help interpret changes in market sentiment.
Replay and Historical Analysis
Review previous market sessions minute by minute through recorded session replay. You can also revisit strike history by day to study how positioning developed over time.
- Minute-by-minute session replay
- Historical strike data
- Day-level strike history
- Recorded market sessions
Built For Indian Derivatives Traders
The platform is designed for traders and analysts who care about open interest, positioning, volatility, and expiry setups rather than chart-heavy interfaces.
It supports analysis across NIFTY, SENSEX, stock options, and futures, with broker connectivity providing the market data used throughout the platform.
The service supports multiple Indian brokers, with broker availability enabled in phases. Your own SEBI-registered broker account forms the foundation of the connection, while the platform remains focused on analytics rather than execution.
Common Use Cases
NIFTY and SENSEX Analysis
Track open interest, dealer positioning, volatility, sentiment, and option structures around India's major indices.
Stock Options and Futures
Analyze F&O stocks using option-chain metrics, futures OI, dealer positioning, and related volatility data.
Expiry-Day Preparation
Use option activity, OI shifts, GEX, premium behavior, and expiry-focused views to assess positioning around expiry.
Positioning and Sentiment Analysis
Combine OI movements, PCR, Market Mood Index readings, headline sentiment, and dealer positioning for a broader market read.
Historical Market Review
Replay recorded sessions and review historical strike data to understand how market positioning changed throughout a trading session.
Broker-Based Market Data
The platform works around your own broker connection rather than functioning as a trading execution system. It supports many Indian brokers, with availability being enabled in phases.
The platform does not place trades. Its purpose is to provide market analytics and positioning information so traders can make their own decisions.
Pricing
A free daily preview is available for exploring the platform's market analytics. The paid plan provides unlimited access to the full toolset, including the broader set of positioning, volatility, OI, sentiment, replay, and market-monitoring features.
Why It Matters
Derivatives traders often need to combine open interest, option-chain data, volatility, dealer positioning, sentiment, and expiry information before forming a market view. Keeping those signals across separate screens can make quick analysis harder.
This platform brings those perspectives together in one focused workspace, helping traders move from raw market data to a faster read on positioning and potential expiry setups.
Get A Faster Read On Indian Derivatives Markets
Connect your broker, scan the market, and bring open interest, dealer positioning, option-chain analytics, sentiment, volatility, and historical views into one place. The platform is built for Indian derivatives traders who want deeper positioning data without adding order execution to the workflow.


